JavaFX LineChart
Jakob Jenkov |
The JavaFX LineChart can draw line charts inside your JavaFX applications. The JavaFX LineChart component is
represented by the class javafx.scene.chart.LineChart .
LineChart X Axis and Y Axis
A JavaFX LineChart draws a line chart. A line chart is a two-dimensional graph, meaning the graph has an X axis
and a Y axis. Line charts typically have two numerical axes. A numerical axis is represented by the
JavaFX class javafx.scene.chart.NumberAxis .
You need to define the X axis and Y axis used by a LineChart.
Here is an example of creating two JavaFX NumberAxis instances:
NumberAxis xAxis = new NumberAxis();
xAxis.setLabel("No of employees");

NumberAxis yAxis = new NumberAxis();
yAxis.setLabel("Revenue per employee");
Creating a LineChart
You create a JavaFX LineChart component by creating an instance of the LineChart class.
You need to pass an X axis and Y axis to the LineChart constructor. Here is a
JavaFX LineChart instantiation example:
NumberAxis xAxis = new NumberAxis();
xAxis.setLabel("No of employees");

NumberAxis yAxis = new NumberAxis();
yAxis.setLabel("Revenue per employee");

LineChart lineChart = new LineChart(xAxis, yAxis);
LineChart Data Series
To get a JavaFX LineChart component to display any lines, you must provide it with a data series.
A data series is a list of data points. Each data point contains an X value and a Y value. Here is an example
of creating a data series and adding it to a LineChart component:
XYChart.Series dataSeries1 = new XYChart.Series();
dataSeries1.setName("2014");

dataSeries1.getData().add(new XYChart.Data( 1, 567));
dataSeries1.getData().add(new XYChart.Data( 5, 612));
dataSeries1.getData().add(new XYChart.Data(10, 800));
dataSeries1.getData().add(new XYChart.Data(20, 780));
dataSeries1.getData().add(new XYChart.Data(40, 810));
dataSeries1.getData().add(new XYChart.Data(80, 850));

lineChart.getData().add(dataSeries1);
First an XYChart.Series instance is created and given a name.
Second, 6 XYChart.Data instances are added to the XYChart.Series object.
Third, the XYChart.Series object is added to a LineChart object.
It is possible to add multiple data series to the LineChart . Just repeat the above code
for additional data series.
Adding a LineChart to the Scene Graph
To make a LineChart visible you must add it to the JavaFX scene graph. This means adding the
LineChart to a Scene object or add the LineChart to a layout
component which is added to a Scene object.
Here is an example that adds a LineChart to the JavaFX scene graph:
package com.jenkov.javafx.charts;

import javafx.application.Application;
import javafx.scene.Scene;
import javafx.scene.chart.LineChart;
import javafx.scene.chart.NumberAxis;
import javafx.scene.chart.XYChart;
import javafx.scene.layout.VBox;
import javafx.stage.Stage;

public class LineChartExperiments extends Application {

    @Override
    public void start(Stage primaryStage) throws Exception {
        primaryStage.setTitle("LineChart Experiments");

        NumberAxis xAxis = new NumberAxis();
        xAxis.setLabel("No of employees");

        NumberAxis yAxis = new NumberAxis();
        yAxis.setLabel("Revenue per employee");

        LineChart lineChart = new LineChart(xAxis, yAxis);

        XYChart.Series dataSeries1 = new XYChart.Series();
        dataSeries1.setName("2014");

        dataSeries1.getData().add(new XYChart.Data( 1, 567));
        dataSeries1.getData().add(new XYChart.Data( 5, 612));
        dataSeries1.getData().add(new XYChart.Data(10, 800));
        dataSeries1.getData().add(new XYChart.Data(20, 780));
        dataSeries1.getData().add(new XYChart.Data(40, 810));
        dataSeries1.getData().add(new XYChart.Data(80, 850));

        lineChart.getData().add(dataSeries1);

        VBox vbox = new VBox(lineChart);

        Scene scene = new Scene(vbox, 400, 200);

        primaryStage.setScene(scene);
        primaryStage.setHeight(300);
        primaryStage.setWidth(1200);

        primaryStage.show();
    }


    public static void main(String[] args) {
        Application.launch(args);
    }
}
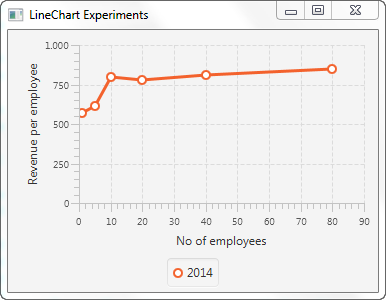
The application resulting from running this application would look similar to this:
| Tweet | |
Jakob Jenkov | |